
The Distribution Variance: What Disrupted Supply Chains Reveal About Trapped P&L Capital
For mid-market manufacturing operators, industrial distributors, and distribution-reliant businesses, the global logistics ecosystem has devolved into a state of permanent volatility. The traditional playbook for balancing moving freight costs against inventory velocity has fundamentally fractured under the weight of structural market shifts.
Industrial leaders are navigating complex infrastructure constraints, each of which was individually classified as a "once-in-a-generation" anomaly but now occur with compounding frequency and greater operational impact. From the prolonged maritime diversions surrounding the blockage of the Suez Canal and military standoffs near the Strait of Hormuz, to critical low-water bottlenecks in the Panama Canal and acute capacity rebalancing across major domestic truckload lanes, disruption has normalized.
Yet, when executive teams gather in the boardroom to address these challenges, their strategic reflex is almost always defensive. They treat escalating third-party logistics (3PL) fees, volatile fuel surcharges, and rigid freight contract structures as unchangeable macroeconomic realities—a static cost of doing business that must simply be absorbed or passed along to an already price-sensitive customer base.
This is a critical error in financial stewardship.
In the mid-market, executive teams frequently fall victim to what can be qualified as the distribution efficiency trap: the mistaken assumption that because a logistics team successfully moves product from dock to destination on schedule, the underlying contract architecture is financially optimized.
When evaluated through the lens of Structural Profit Optimization (SPO), ongoing marketplace disruptions are not cost drivers. They are diagnostic alarms revealing systemic, unmonitored capital leakage. Industry benchmarks confirm that mid-market manufacturers and distribution-reliant firms leak an average of 4% of their total operating spend directly into specialized vendor margins through un-enforced contract tiers, invoicing drift, and structural cost creeping across their peripheral overhead.
By shifting from a defensive operational posture to an offensive cost-reclamation strategy, independent operators can transform these distribution challenges into an internal funding engine.
I. The Anatomy of the Trap: Out-of-Tolerance Surcharges and Invoice Drift
To understand how distribution networks routinely drain capital, one must look at the structural complexity of a standard industrial freight or logistics invoice.
Unlike raw material inputs, which feature highly visible, predictable line-item costs, the final cost of moving an industrial asset is dictated by an opaque matrix of base rates, regional zone multipliers, and shifting accessorial surcharges. Because internal shipping teams are focused entirely on delivery velocity and operational compliance, they rarely have the data tools or the capacity required to audit the forensic fidelity of every freight bill.
This operational blind spot creates an immediate environment for severe contract decay:
+-------------------------------------------------------------------+
| THE FREIGHT CONTRACT INERTIA ENGINE |
+-------------------------------------------------------------------+
| BASELINE RATED EXPECTATION | REALIZED TRANSACTIONAL DRIFT |
| • Negotiated line-haul rate per cwt | • Automated fuel index pegs |
| • Standard accessorial baseline | • Un-enforced volume tiers |
| • Static carrier classification | • Undetected billing errors |
+-------------------------------------------------------------------+ | v
+-------------------------------------------------------------------+
| THE RESULT: An invisible 12% to 18% cost premium quietly |
| bypasses standard Accounts Payable matching parameters. |
+-------------------------------------------------------------------+
When supply chains face disruption, carriers do not simply raise their visible base rates; they quietly adjust their ancillary surcharge rules. Fuel adjustments are pegged to legacy matrixes that favor the vendor’s margin. Dimensions and freight classifications are automatically re-rated by carrier software, and accessorial fees—such as detention charges, liftgate premiums, and redelivery penalties—are applied automatically without line-level verification.
Independent transportation data confirms that freight invoice billing errors are an industry-wide baseline exception, rather than an anomaly. Peer-reviewed research evaluating automated validation architectures reveals that manual invoice auditing leaves companies highly vulnerable to systematic billing creep, while best-practice digital data reconciliation captures structural improvements of 12% to 20% in total logistics cost efficiency. Research index data is openly accessible via The International Journal of Logistics Management.
Because accounts payable departments default to processing these bills as standard utility invoices, the overcharges bypass standard financial controls. The carrier’s automated billing system extracts an un-negotiated premium, and the manufacturer’s P&L absorbs the margin erosion completely unnoticed.
II. The Core Lesson: Over-Specification and Network Stagnation
The true lesson to be learned from recent distribution disruptions is that operational compliance frequently masks massive capital waste. When networks are strained, internal teams naturally over-specify their logistics requirements to guarantee service continuity. They buy excess capacity, lock into high-tier committed volumes, and accept premium routing options just to prevent a localized bottleneck.
Over a 12-month cycle, this defensive over-specification hardens into structural waste. Consider how this manifests across the extended distribution and service footprint:
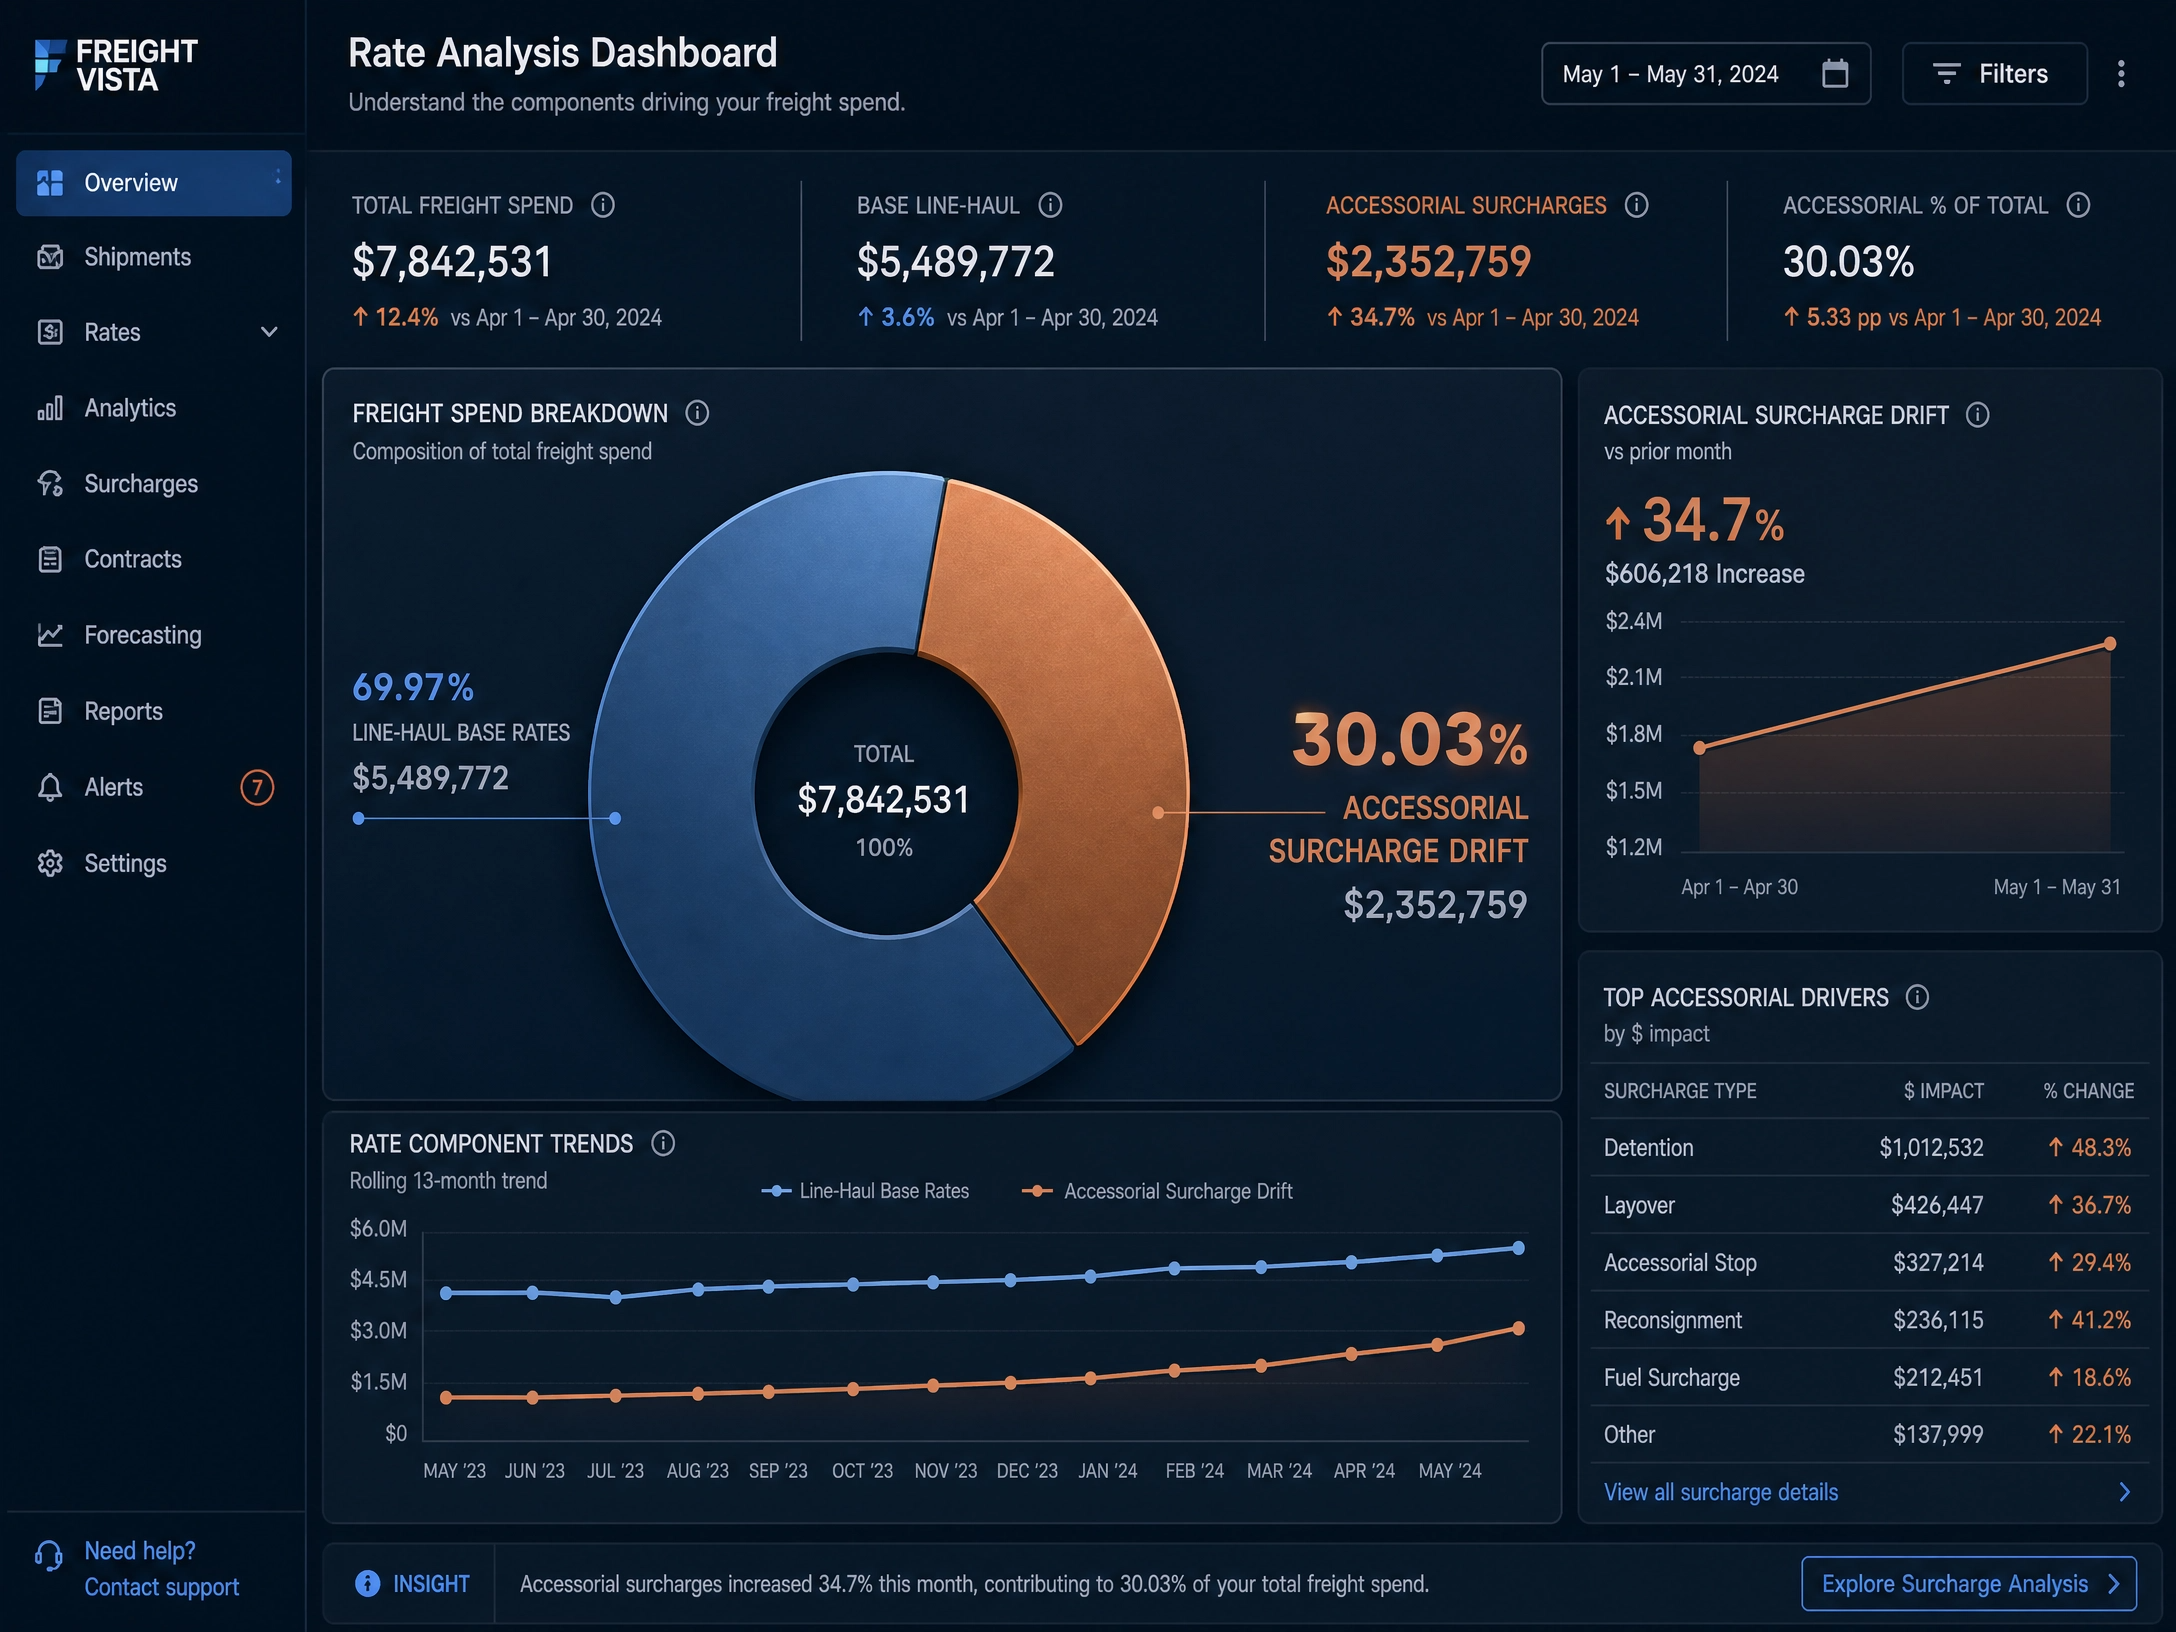
Less-Than-Truckload (LTL) Volatility: Operators routinely pay for dedicated trailer space or premium freight classes when a zero-based needs assessment reveals their pallet configurations could be optimized to match lower, specialized commodity tiers.
Small Package Shipping Logistics: Distribution-adjacent operations force mid-market firms to rely heavily on national parcel carriers. Without transactional database benchmarks, firms accept standard corporate rate-card discounts, completely blind to the fact that up to 30% of their total parcel spend is composed of fine-print surcharges that could be structurally optimized.
Fleet and Fuel Network Creep: For operators running internal delivery networks, fleet fuel card programs and maintenance contracts are highly susceptible to surcharge drift. Price-per-gallon discounts are un-enforced at the regional level, and administrative management fees gradually climb without triggering an AP audit threshold.
Greg Rusnell, Managing Director at Profit Logic, frames the breakdown:
"Most operators think their shipping costs are locked down because their internal team ran an RFP last year. But a standard RFP doesn't go deep enough. If you aren't cross-referencing your actual line-by-line invoices against a live, national database of real transactional prices, you're just haggling over the sticker price. The vendors know this, and they hide their true profit margins in the fine print of the surcharges where your team isn't looking."
III. Structural Profit Optimization: Reclaiming the Modernization Dividend
Resolving this vulnerability requires a fundamental departure from traditional cost-reduction exercises. Trying to fix distribution inefficiencies by forcing an internal purchasing team to casually re-negotiate with incumbent carriers is a losing strategy. The carrier's sales team handles these data battles daily; your internal team handles them once every three years.
Our forensic approach begins by treating logistics data as a diagnostic entry point. We map the line-haul inefficiencies, accessorial overcharges, and routing over-specifications to isolate immediate cash leakage. However, the true execution of Structural Profit Optimization (SPO) expands past the shipping dock.
Because specialized vendor behaviors are uniform, the exact same information asymmetries and contract decay uncovered in logistics are systematically mirrored across other complex, non-strategic areas of the business. Based on a plant's specific operational footprint, we deploy a targeted diagnostic sweep across up to 15 peripheral OpEx categories—including merchant processing, commercial waste logistics, telecom infrastructure, and industrial utility tariffs.
By analyzing the broader overhead architecture alongside distribution accounts, we bypass the data barriers maintained by individual suppliers. This aggregate operational drag can be modeled through a definitive cash flow equation:
Burn = Contract Decay + Surcharge Drift + Forfeited Velocity
Where:
Contract Decay: The financial premium paid due to outdated baseline agreements, un-enforced volume tiers, and a lack of nationwide transactional benchmark data.
Surcharge Drift: The continuous, unmonitored accumulation of auxiliary fees, indexing errors, and administrative variances that bypass standard billing checks.
Forfeited Velocity: The compounding loss of non-dilutive capital that should have been used to fund automated modernization, warehouse management system (WMS) upgrades, or facility expansion.
Case Study: Reclaiming Operational Liquidity
Consider an independent mid-market manufacturer and distribution-reliant business generating $50 million in annual revenue. Facing an array of localized line-haul increases, their internal team secured what they believed was an optimized agreement, managing a pre-reviewed base rate of $1,100,000 in annual shipping costs.
When an independent forensic SPO review was launched, we performed a comprehensive line-item invoice scrape across 12 months of live shipping files, cross-referencing them against our national benchmark network. The diagnostic uncovered that while the top-line base rate appeared competitive, the carrier had quietly modified their regional zone mappings and applied automated fuel index modifiers that completely eliminated the internal team's hard-won savings.
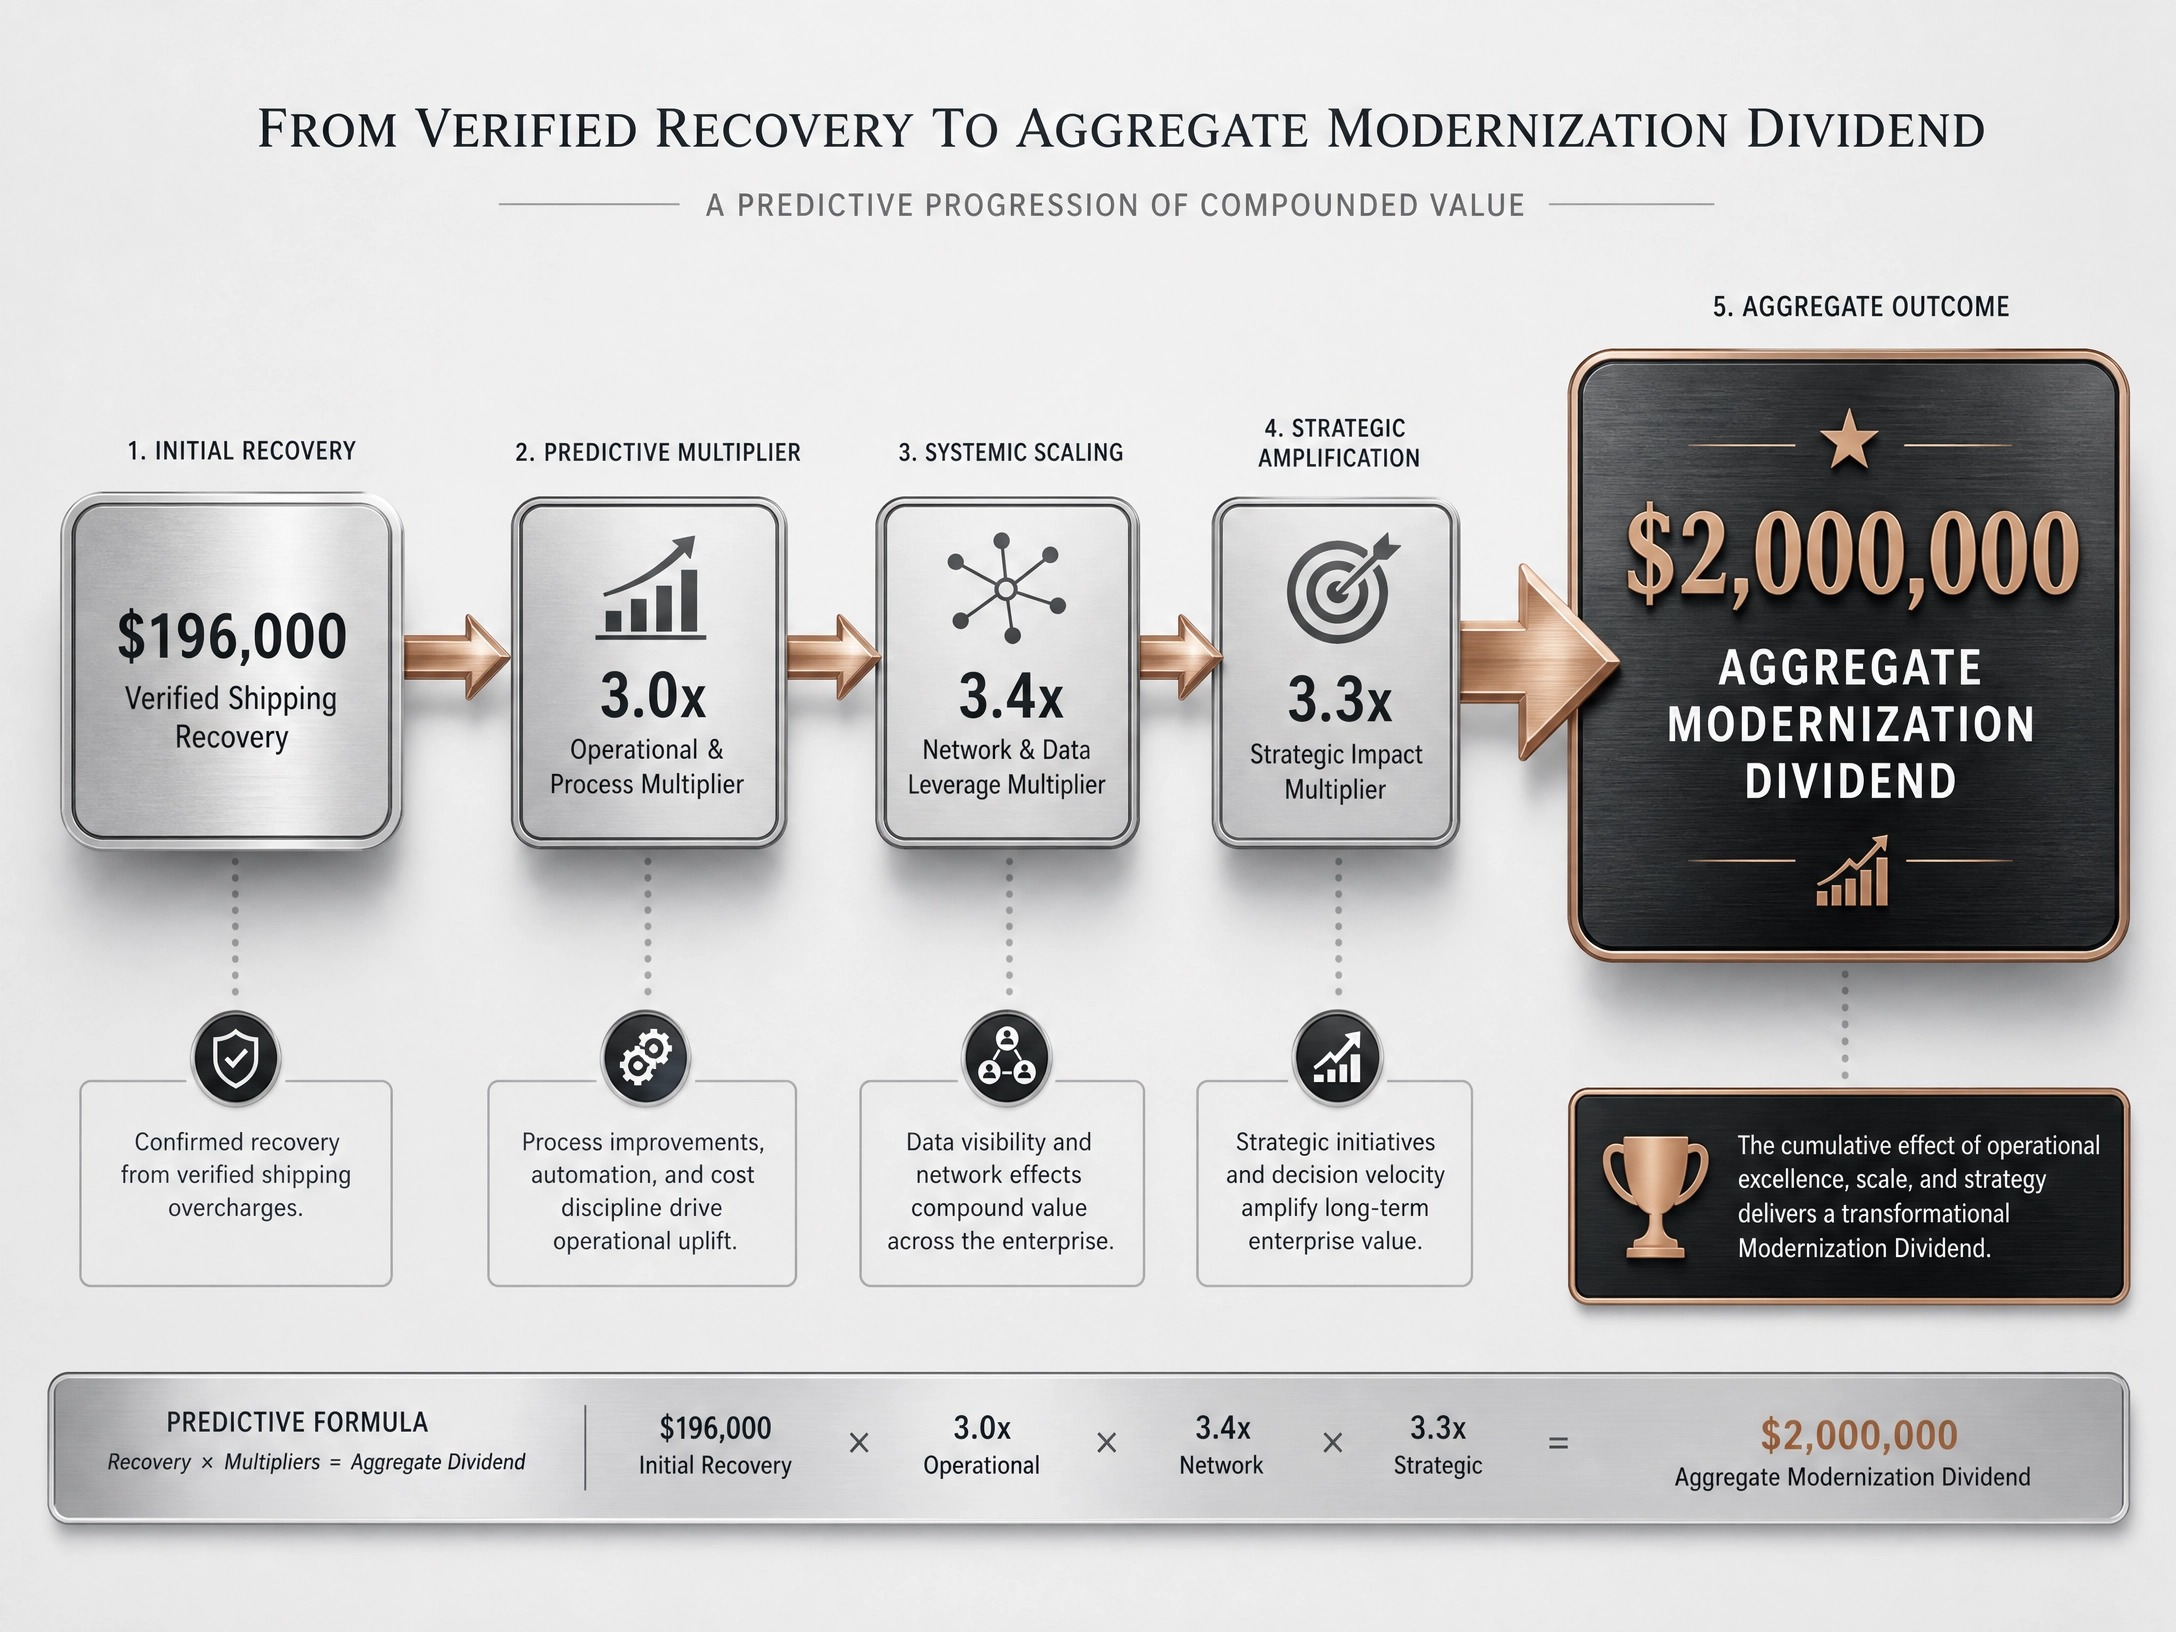
By stripping away over-specified service tiers, correcting billing errors, and enforcing strict contract guardrails, the forensic review captured an immediate, verified $196,000 in annualized logistics savings—achieving a 17.8% top-line cost reduction within that single focus category without changing a single preferred carrier or disrupting customer delivery windows.
While this specific $196,000 win was locked down purely within shipping and logistics, the broader strategic value lies in projection. When this same forensic data-matching is extended across the other complex administrative and operational cost categories running throughout the rest of the enterprise, the aggregate leakage consistently averages 4% of the total P&L. On this standard $50 million P&L, that math maps out to a total of $2,000,000 in annualized, recurring cash flow that is currently trapped inside un-optimized vendor agreements—capital that can be entirely repurposed as an internal funding engine.
IV. Shared Success Stewardship: Moving Beyond the Audit
Most consulting firms operate on a "one-and-done" audit model. They point out historical billing errors, hand your accounts payable team a complex spreadsheet of recommendations, submit an invoice for a heavy retainer, and exit the building.
At Profit Logic, we reject this approach. An audit only tells you how much money you have already lost; shared success stewardship is about permanently protecting your capital velocity over the entire lifecycle of the contract.
Our methodology represents a complete operational shift for independent manufacturing and distribution leaders:
1. Outcome-Aligned, Zero-Risk Engagement
The complete forensic discovery, line-level invoice scrape, and contract optimizations require zero upfront capital outlay from your running operational budget. Our work is entirely self-funded out of the verified, net-positive cash flow we successfully deliver back onto your balance sheet. If we don't find the leakage, you owe us nothing.
2. Active Lifecycle Contract Policing
We remain in the trenches with your team over the course of the full contract lifespan. We take on the technical burden of validating carrier implementation, monitoring billing fidelity, and continuously auditing incoming invoices to permanently block vendor rate-creep and administrative decay.
3. Turning Waste Into An Internal Venture Fund
By deploying a success-aligned partner to permanently recover this structural 4% leakage across your P&L, you instantly activate an internal capital fund inside your business. You do not need to take on high-interest equipment loans or dilute your equity with outside investors to fund your next automation upgrade, warehouse management system (WMS) rollout, or facility expansion. You simply reclaim your own capital from administrative inefficiency and channel it directly back into your physical floor plate.
The capital required to insulate your distribution network and drive your next phase of corporate growth isn't hidden in a bank loan. It is trapped right inside your active P&L. Let’s go find it.
